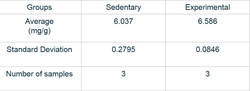
These are the statistics from the gastrocnemious masses from the mice who were analyzed.
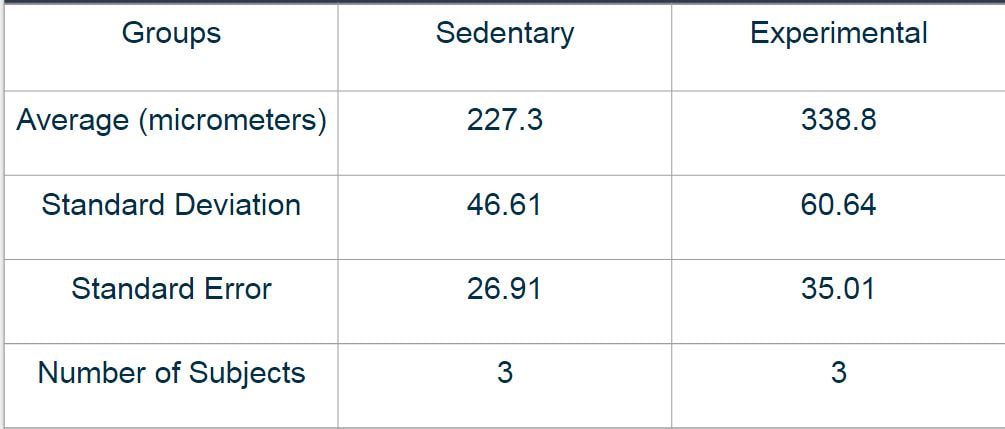
These results are statistics from the images that were traced.The images focused on the cross sectional are (CSA) and these are the two groups in comparison.
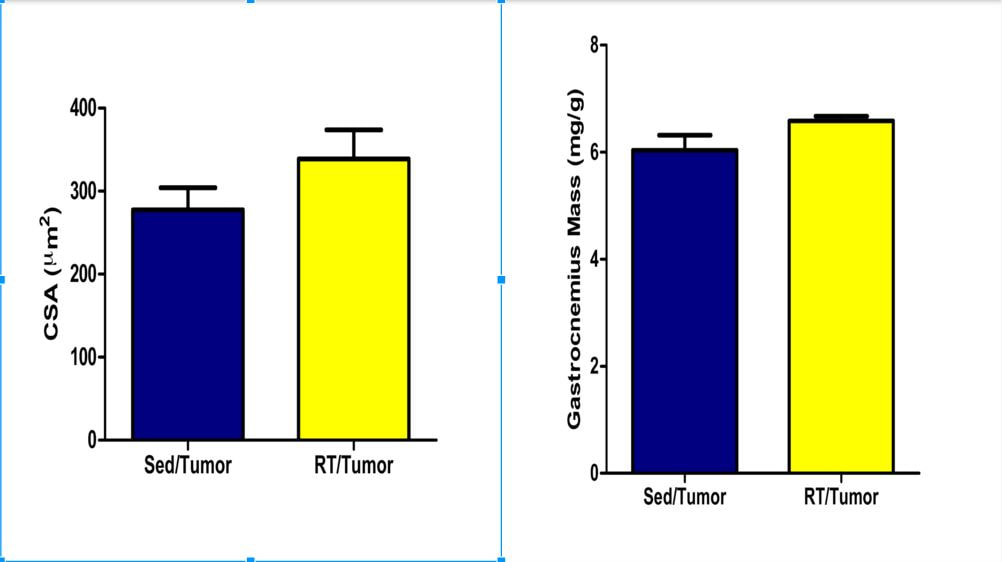
The graph to the left plots the results from the second table shown above while the graph to the right sows the data collected from the first table.
The statistics above were collected through a series of tests.
These tests include...
Unpaired t-test
Descriptive statistics
Cohen's d test
These tests include...
Unpaired t-test
Descriptive statistics
Cohen's d test
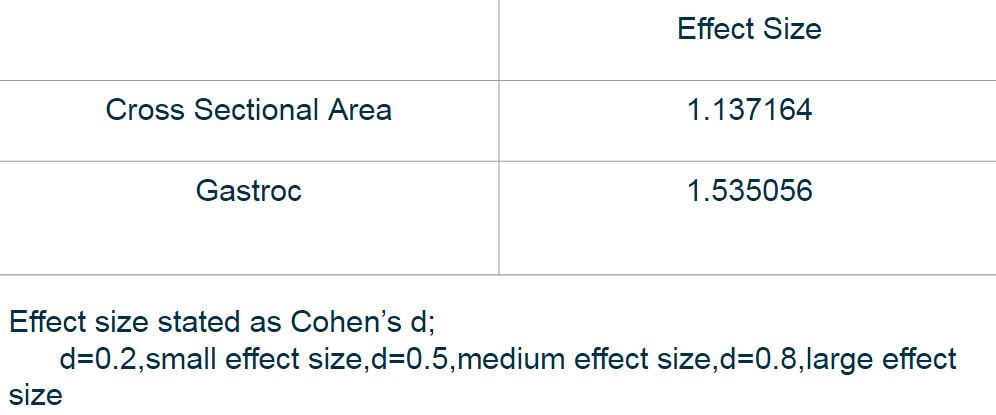
Cohen's d test takes into account the small sample size that was collected and analyzes the data to approximate the necessary sample size to conclude as statistically significant.As presented in the table above,this study only requires a few more samples,approximately 2-3,in order to show a statistical difference between the two studied groups.
